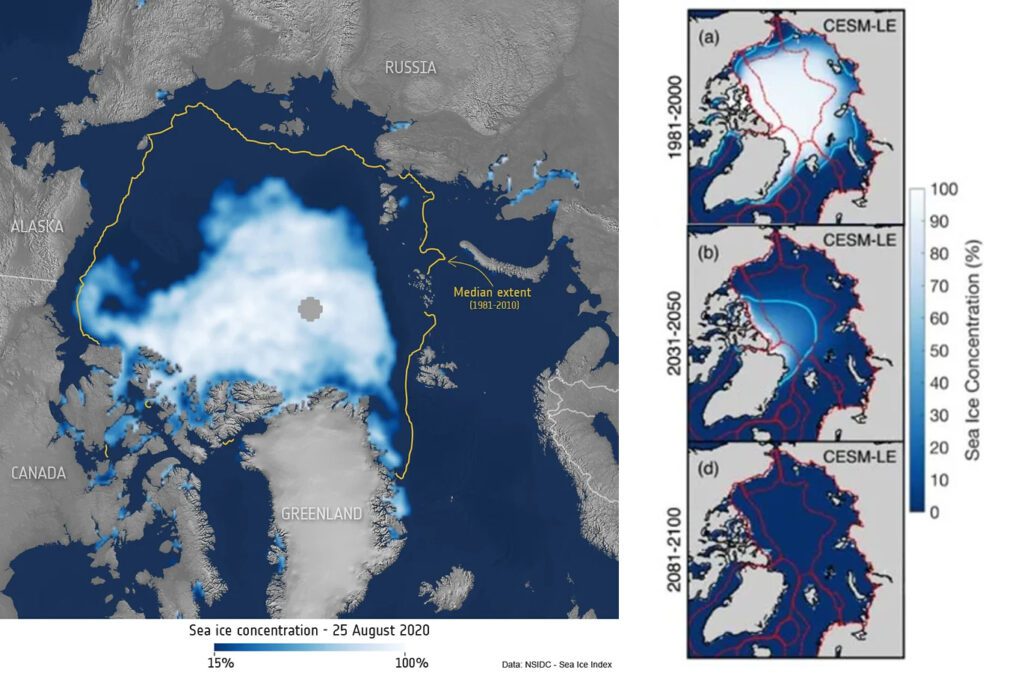
Average September sea ice concentration from the Community Earth System Model (CESM-LE) over the period of 1981–2000; 2031–2050 and 2081–2100. Red borders are EEZs. The cyan line shows the 15% sea ice concentration contour. Figure indicates the thickest ice in white remains in the Canadian Archipelagos.
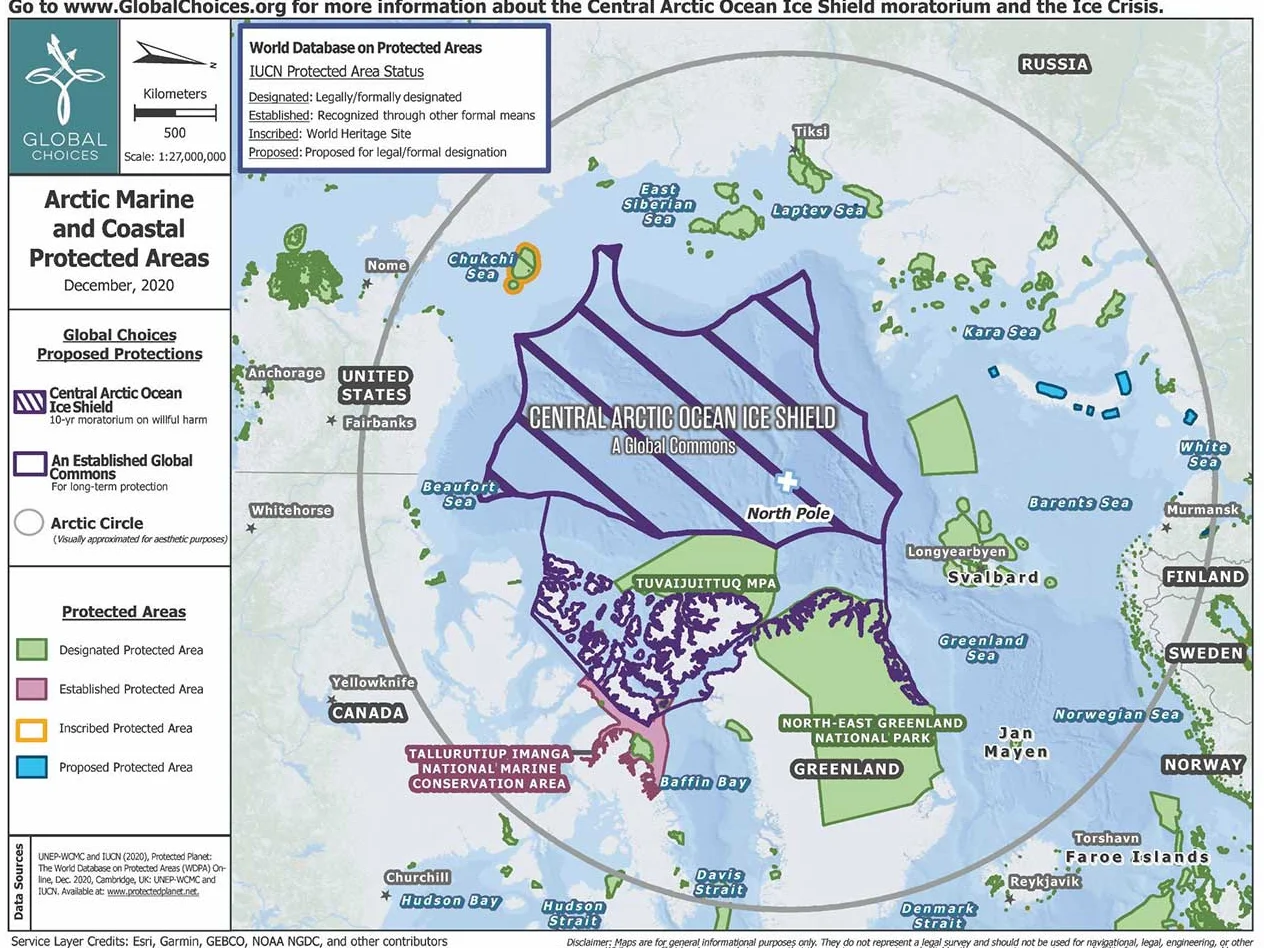
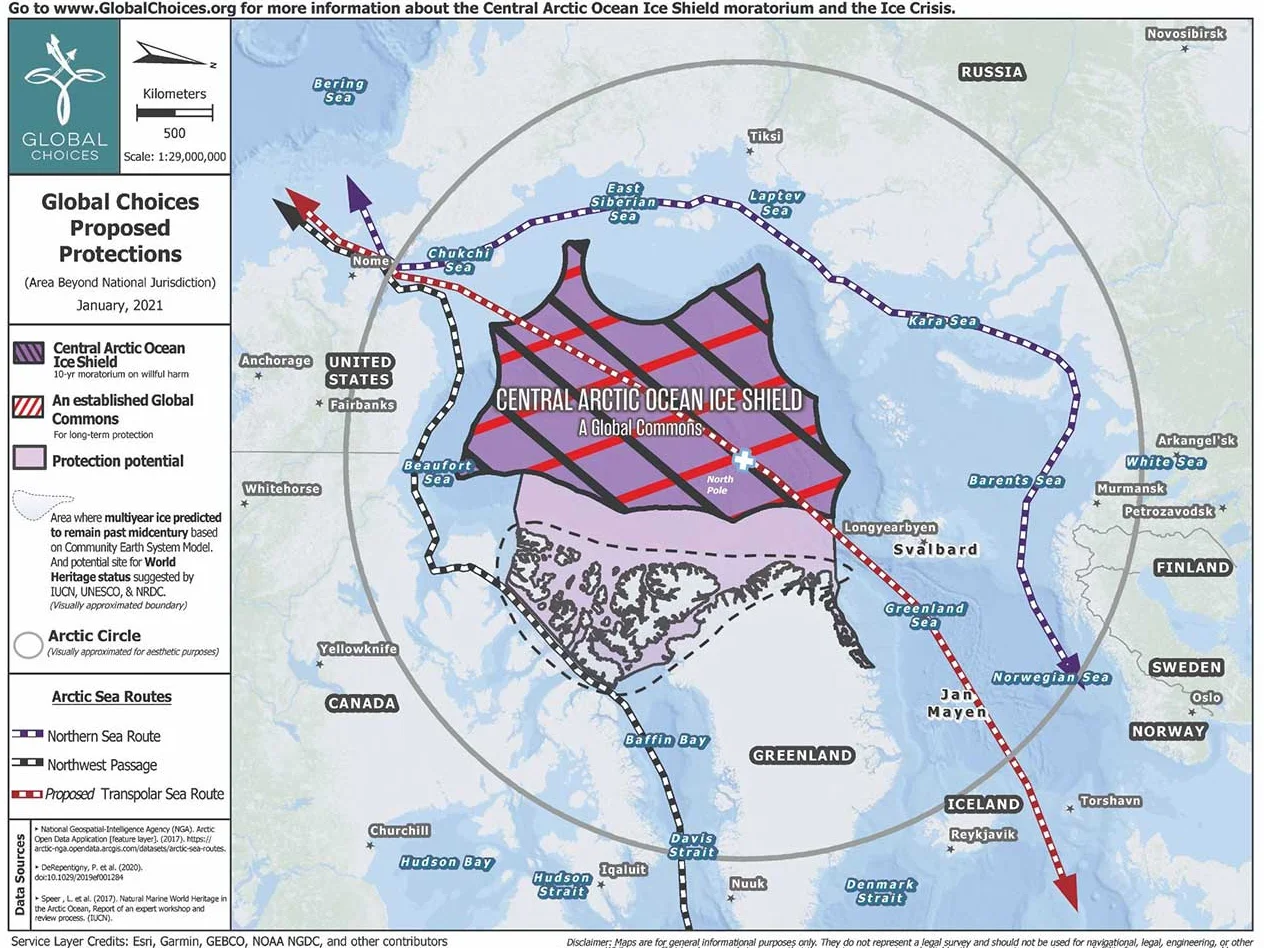
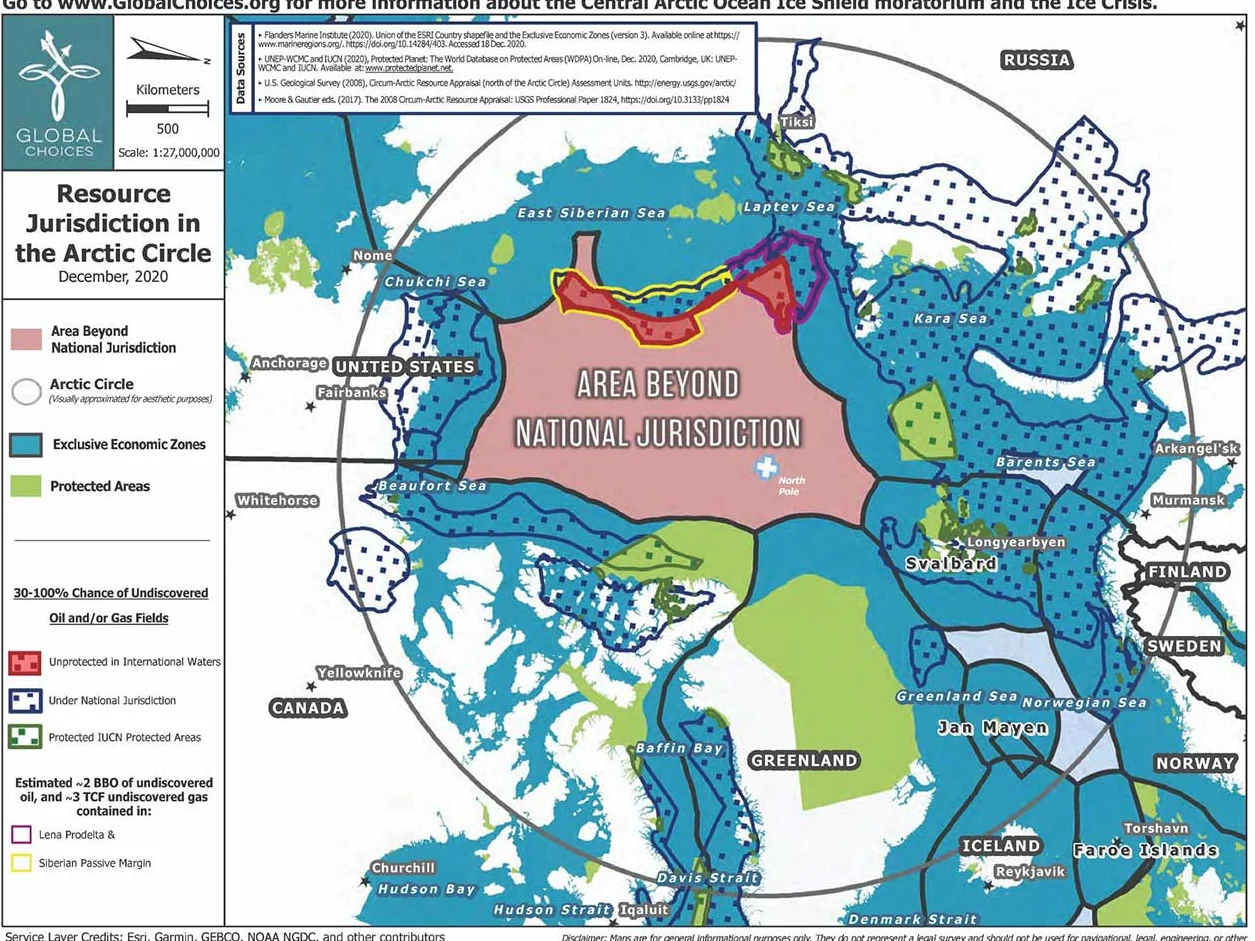
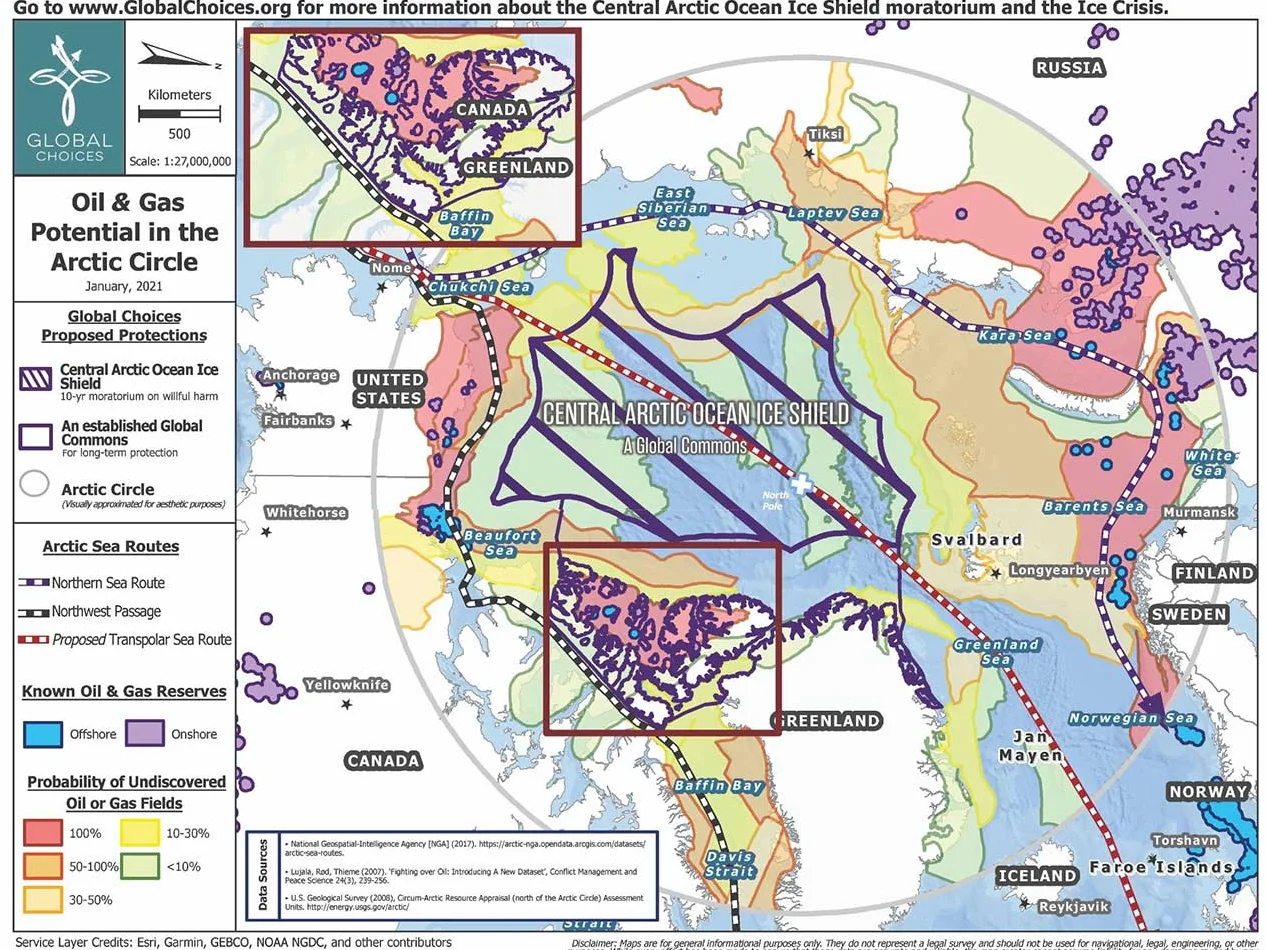
All maps are the property of GlobalChoices.org. To preserve the correct source attribution and readability, please do not crop the maps. The maps may be freely shared for educational and noncommercial purposes, as long as the logo of Global Choices is clearly visible and cited accordingly. Central Arctic Ocean Ice Shield Moratorium, www.GlobalChoices.org